How to Get Laravel Debugging to work with PHPStorm and MAMP Pro 5
This has been one of the more aggravating things I’ve had to deal with in setting up software for development. I’ve followed the official documentation from JetBrains, over 30 other blog tutorials, and literally failed in getting any of them to work.
I figured out an easy way to make the setup work so I’m sharing it in case someone else finds it useful and for self-reference since I’ll probably forget how to do this again in 6 months when I start a new project.
MAMP Configuration
- Load MAMP and setup your host. Make note of the host name as you will need it to configure PHPStorm.
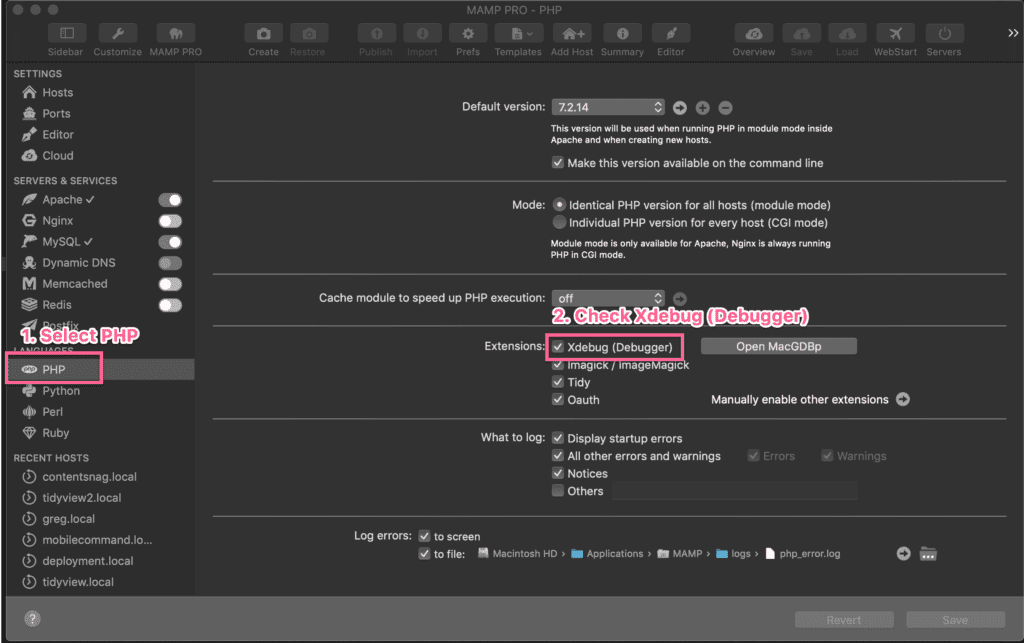
- Go to PHP on the left under Languages.
- On the right under Extensions, check Xdebug (Debugger).
PHPStorm Configuration
- Load PHPStorm and load your Laravel project.
- Setup your PHP executable and interpreter as per the official documentation and then resume here.
- On the top right of PHPStorm, select Edit Configurations from the dropdown.

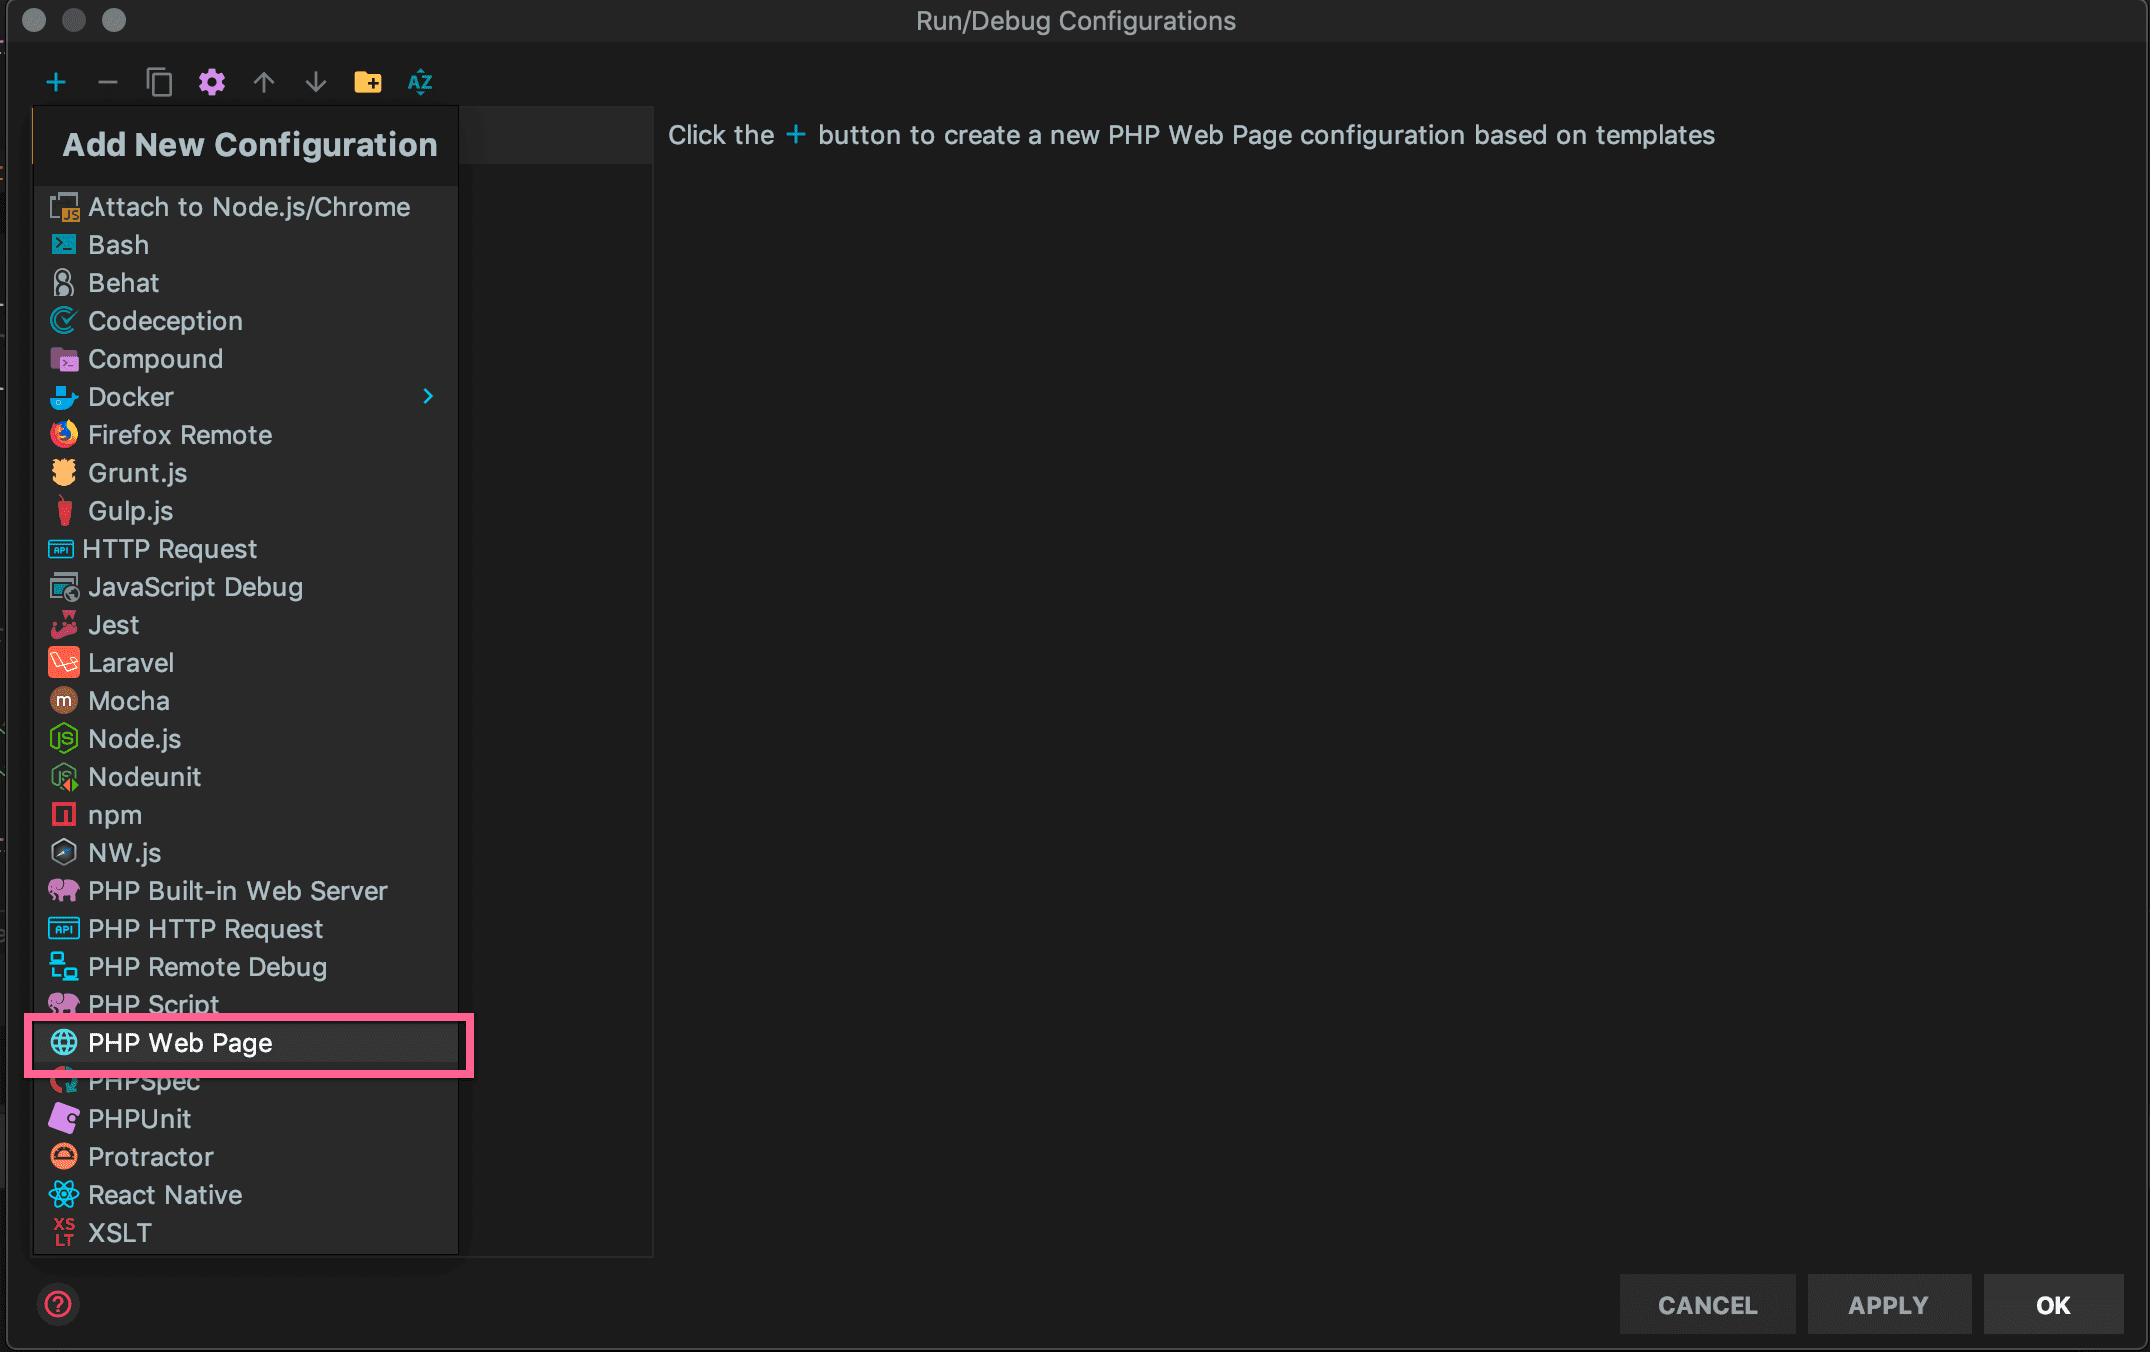
- Click on the Plus Button on the top left of the dialog and then select ‘PHP Web Page’.

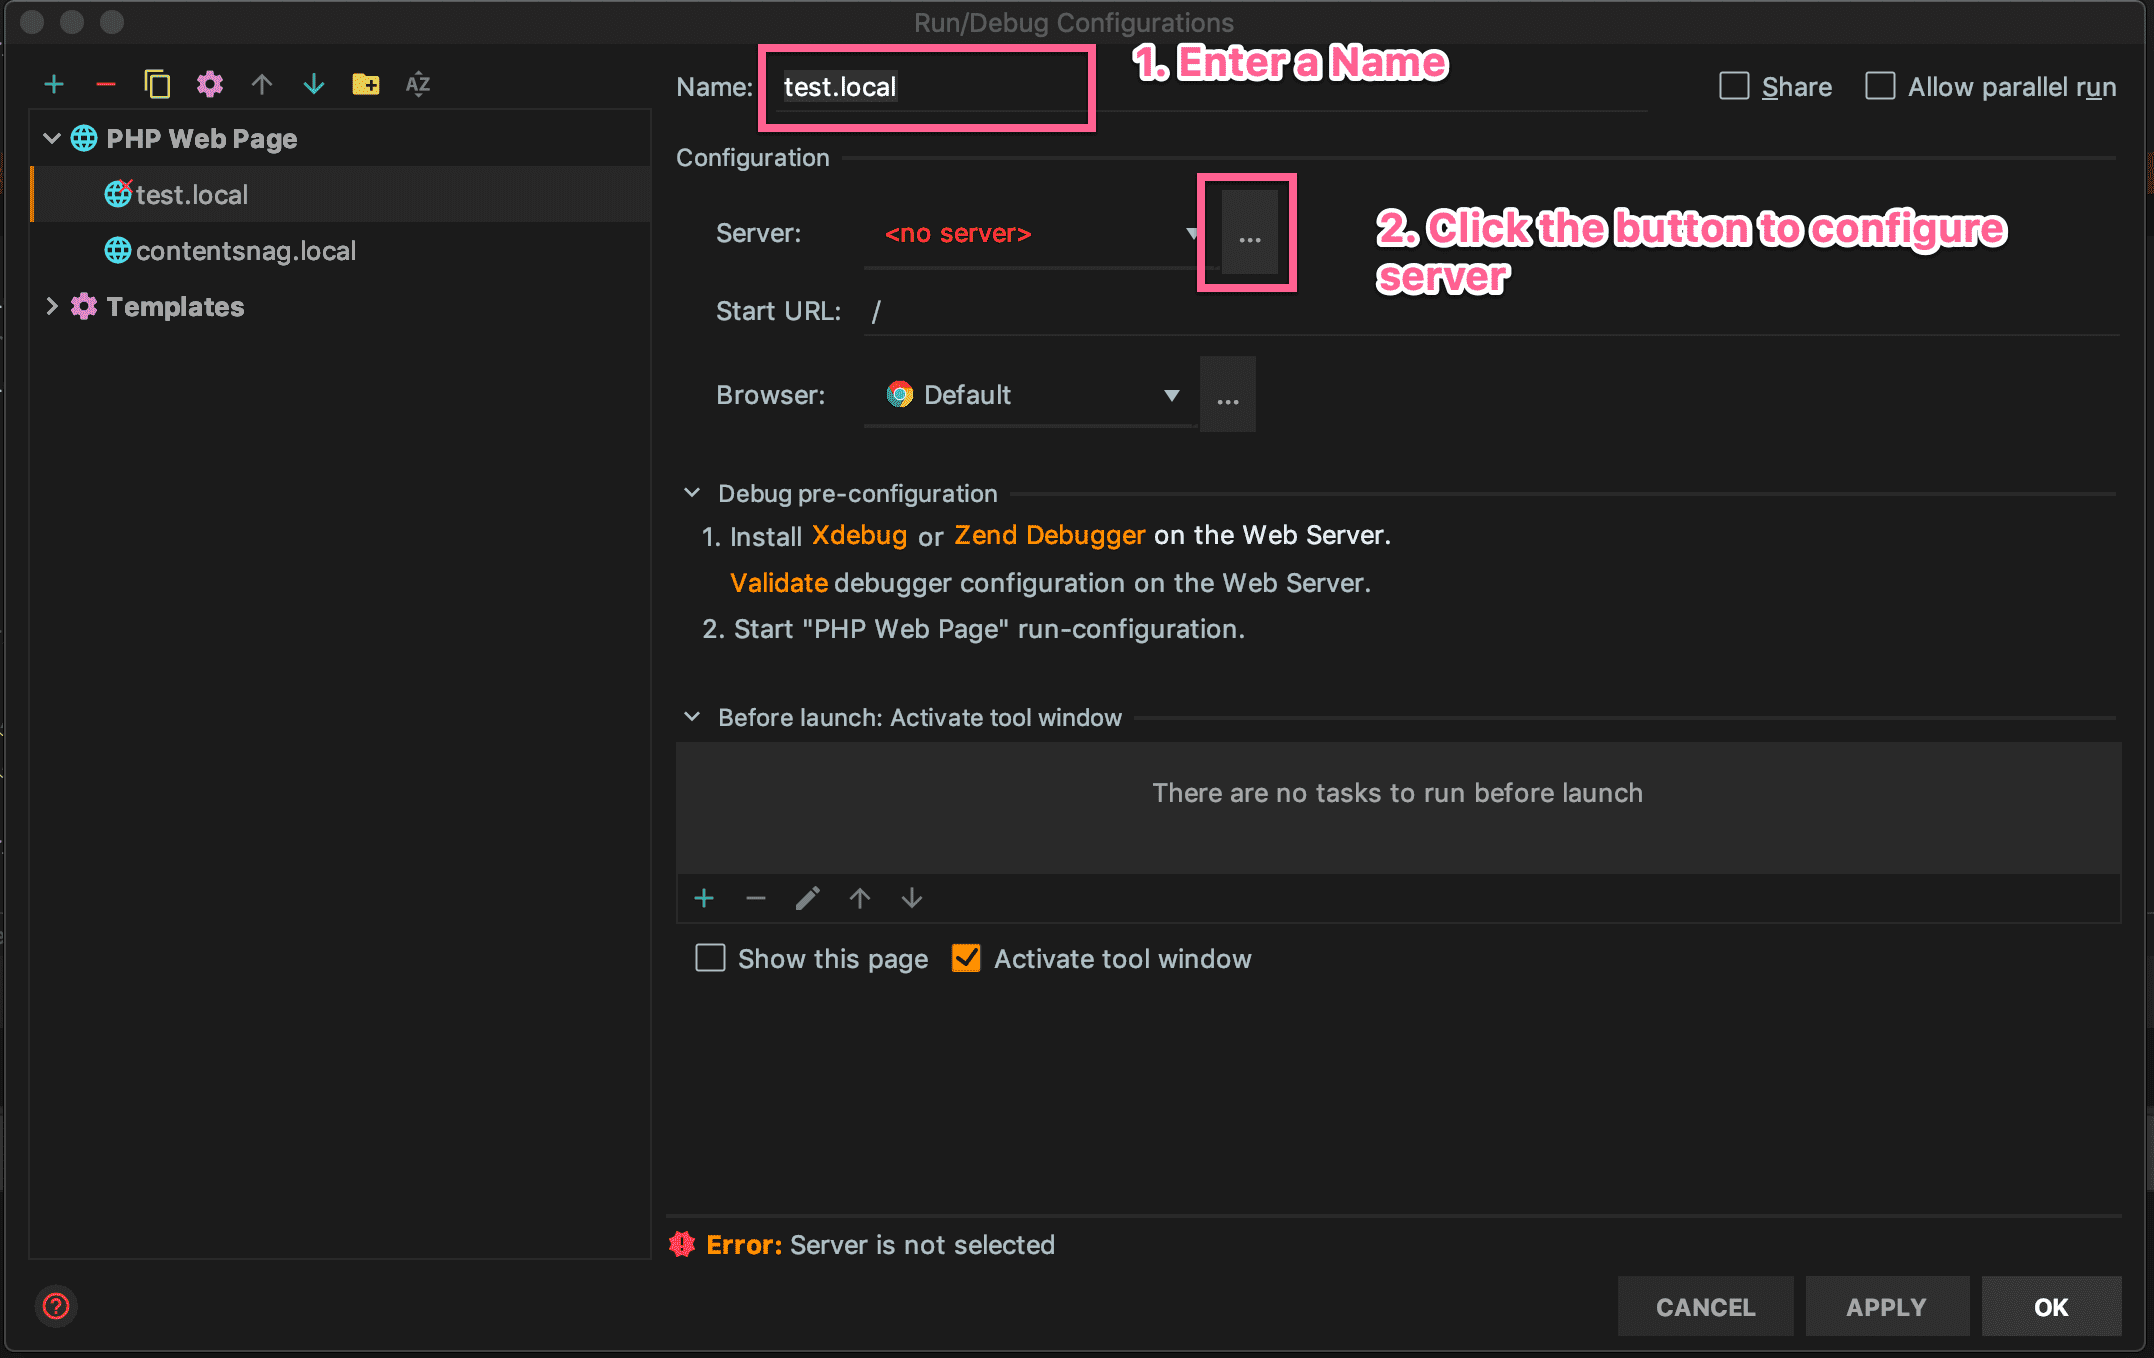
- Enter a descriptive name in the textbox. I use the host name from MAMP so it’s easy to identify visually. Click on the 3 dots with next to Server.

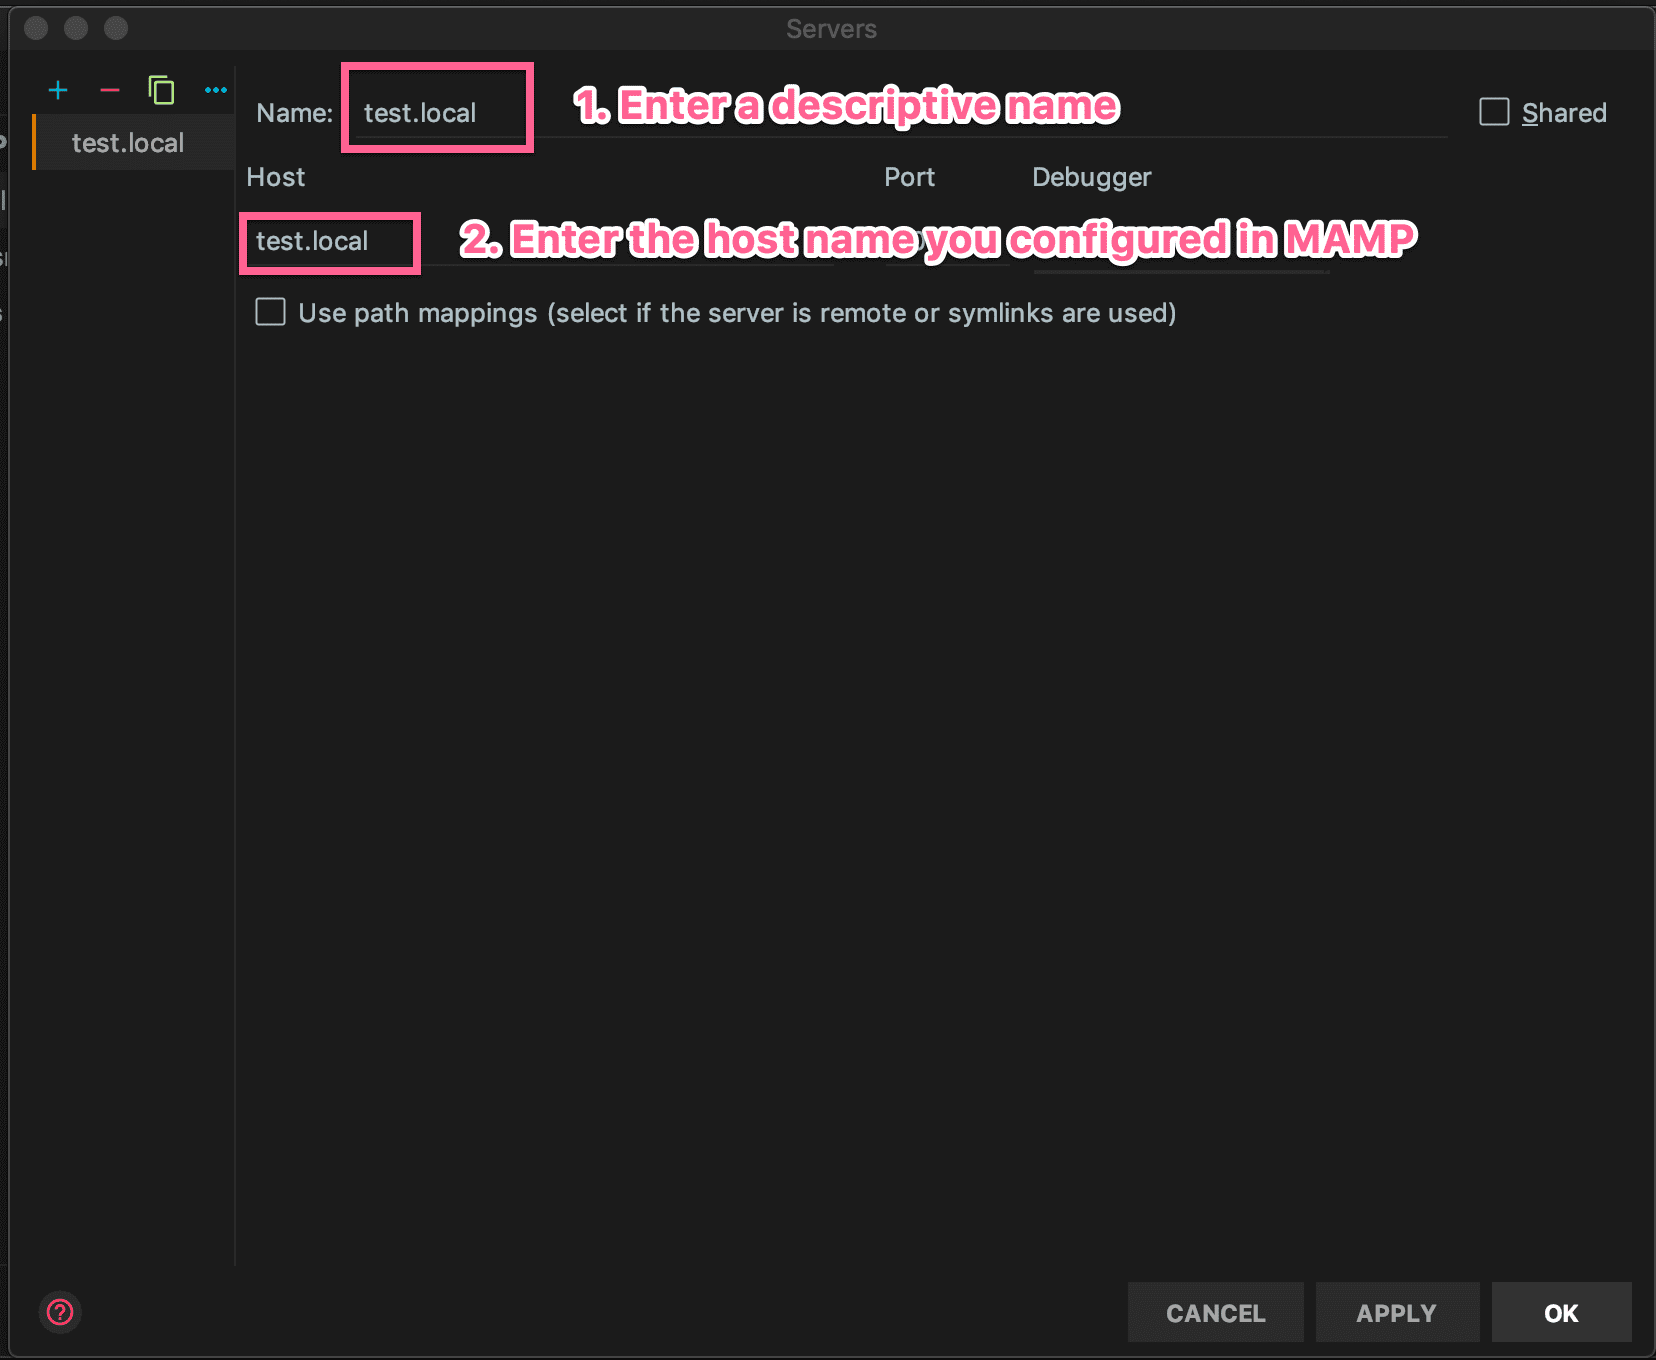
- Enter a descriptive name. I use the host name here as well. For the host, omit the http/https and just add the host name from MAMP.

- Click OK
- Now add your breakpoints and click on the Debugger Button on the top right and PHPStorm will load the site into the browser and break when breakpoints are hit.

Happy debugging!

Related Article
Administration
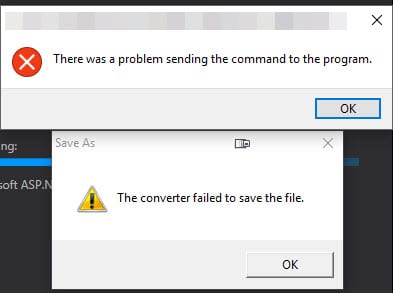
How to Fix ‘Converter Failed to Save File’ with Excel 2016
Read Article
Related Article
Administration
Thank you. It works!
Glad it helped!